“The saddest thing about the Steve Jobs hagiography is all the young “incubator twerps” strutting around Mountain View deliberately cultivating their worst personality traits because they imagine that’s what made Steve Jobs a design genius. Cum hoc ergo propter hoc, young twerp. Maybe try wearing a black turtleneck too.”
Juicy Toms
Capitalism fails: and yet the Right continues to thrive. Why?
Very good column by Fintan O’Toole in today’s Irish Times.
For the last 30 years, the Finnish president has been a social democrat. This time, the social democratic candidate, a former prime minister, got just 6.7 per cent of the vote. The conservative candidate won in a landslide, with 62 per cent.
As ever, there were specific local factors at work. But the Finnish election was also entirely consistent with a much larger pattern: the eclipse of the traditional mainstream European left. Or, to put it the other way around, the extraordinary dominance of the conservative right in the midst of a profound crisis of neo-liberal capitalism.
Almost everywhere you look, social democrats are being punished for the failure of right-wing orthodoxies. Europe desperately needs a counter-balance to the one-track mind of monetarism. Ireland desperately needs a European Union that rediscovers the old left-of-centre values of solidarity, social justice and the common good. But social democracy is showing all the resilience of a paper hat in a hailstorm.
Since the collapse of Lehman Brothers in 2008, there have been 25 elections in EU countries. By my count, social democratic parties won five of them. But things have been much worse than even this miserable performance suggests. The social democratic victory in Portugal was short-lived. The Greek socialist government has been replaced by a technocratic coalition.
Any sane observer, he continues, “looking at these results without knowing the broader circumstances would conclude that neo-liberal capitalism was thriving and that right-of-centre European parties were proving themselves to be paragons of economic and political management.”
He’s right. So what happened to the Left?
O’Toole blames Tony Blair. Under the spell of his electoral dominance in Britain, the Left came to believe that right-wing economics would create the wealth and left-wing politics would redistribute it.
Deregulated financial markets would generate vast wealth for unproductive individuals – but that was okay because social democratic governments would cream some off the top to invest in health, education and the alleviation of the inevitable poverty. The flaws in the plan are now obvious, even to Mandelson: growing inequality would prove to be economically as well as socially corrosive; many of the filthy rich didn’t actually “pay their taxes”; and deregulated financial markets created giant Ponzi schemes that were certain to collapse.
Yep. But that still leaves unanswered the question of why, in the face of such a crisis, are there so few persuasive alternative ideas for how to move on.
Spring?
Spotted in the college gardens this morning.
How to handle 15 billion page views a month
Ye Gods! Just looked at the stats for Tumblr.
500 million page views a day
15B+ page views month
~20 engineers
Peak rate of ~40k requests per second
1+ TB/day into Hadoop cluster
Many TB/day into MySQL/HBase/Redis/Memcache
Growing at 30% a month
~1000 hardware nodes in production
Billions of page visits per month per engineer
Posts are about 50GB a day. Follower list updates are about 2.7TB a day.
Dashboard runs at a million writes a second, 50K reads a second, and it is growing.
And all this with about twenty engineers!
Web design and page obseity
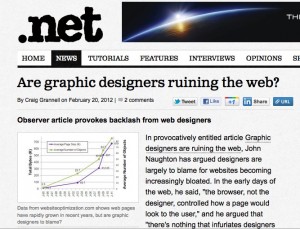
My Observer column last Sunday (headlined “Graphics Designers are Ruining the Web”) caused a modest but predictable stir in the design community. The .Net site published an admirably balanced round-up of comments from designers pointing out where, in their opinions, I had got things wrong. One (Daniel Howells) said that I clearly “had no exposure to the many wonderful sites that leverage super-nimble, lean code that employ almost zero images” and that I was “missing the link between minimalism and beautiful designed interfaces.” Designer and writer Daniel Gray thought that my argument was undermined “by taking a shotgun approach to the web and then highlighting a single favoured alternative, as if the ‘underdesigned’ approach of Peter Norvig is relevant to any of the other sites he discusses”.
There were several more comments in that vein, all reasonable and reasoned — a nice demonstration of online discussion at its best. Reflecting on them brought up several thoughts:
Thanks to Seb Schmoller for the .Net link.
Want to pay lower interest rates on bonds? Get connected.
Sitting next to me at last week’s lecture by Simon Hampton of Google was David Cleevely who in addition to being a successful entrepreneur is also the Founding Director of the Cambridge Centre for Science and Policy. At one point, Simon put up a slide showing the percentage of GDP contributed by the Internet in a wide range of European countries. As the animation flashed by David whispered to me: “wonder if there’s a correlation between those percentages and bond yields?” After the lecture, he cycled off purposefully into the gathering gloom. I suspected that he was Up To Something.
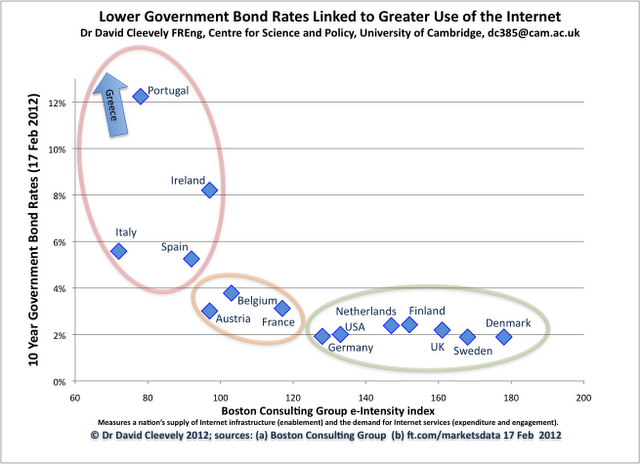
He was. Yesterday he and his son Matthew (who’s currently doing a PhD at Imperial College Business School) published this chart on their blog.
They plotted 10-year governmental bond rates against the Boston Consulting Group’s measure of “e-intensity” for countries in the Eurozone group.
Member states which have not had the capacity to adopt and develop the internet and ecommerce are those with skyrocketing risk premiums on their governments’ debt. These states form a distinct group: Portugal, Italy, Spain, Ireland and Greece (which is literally off the scale) – all with high debt premiums and an e-Intensity score of well under 100.
There are two other groups: those with high e-Intensity and low government bond rates such as Germany, Denmark and the UK, and a middle group (Belgium, Austria and France) with lower e-Intensity (100-120) and raised bond rates of 3-4%.
David and Matthew see two possible (and possibly non-exclusive) explanations for this:
1. Low e-Intensity indicates underlying structural problems: countries with high e-Intensity are those which have invested in modern processes, improved productivity and benefit from strong institutions. These are the countries that have lower borrowing costs, as they are best placed to grow their economies in the future.
and/or
2. e-Intensity (or what it represents) is a fundamental capability: countries which use the internet intensively can respond more flexibly to shocks and crises, instead of being weighed down by cumbersome 20th century processes and institutions.
So…
if you can get a country to invest in, use, and compete on the internet, then you must have either eliminated or minimised any underlying structural problems, or created a flexible and robust economy, or both.
Policymakers, please note.
Winter Sale
From web pages to bloatware
This morning’s Observer column.
In the beginning, webpages were simple pages of text marked up with some tags that would enable a browser to display them correctly. But that meant that the browser, not the designer, controlled how a page would look to the user, and there’s nothing that infuriates designers more than having someone (or something) determine the appearance of their work. So they embarked on a long, vigorous and ultimately successful campaign to exert the same kind of detailed control over the appearance of webpages as they did on their print counterparts – right down to the last pixel.
This had several consequences. Webpages began to look more attractive and, in some cases, became more user-friendly. They had pictures, video components, animations and colourful type in attractive fonts, and were easier on the eye than the staid, unimaginative pages of the early web. They began to resemble, in fact, pages in print magazines. And in order to make this possible, webpages ceased to be static text-objects fetched from a file store; instead, the server assembled each page on the fly, collecting its various graphic and other components from their various locations, and dispatching the whole caboodle in a stream to your browser, which then assembled them for your delectation.
All of which was nice and dandy. But there was a downside: webpages began to put on weight. Over the last decade, the size of web pages (measured in kilobytes) has more than septupled. From 2003 to 2011, the average web page grew from 93.7kB to over 679kB.
Quite a few good comments disagreeing with me. In the piece I mention how much I like Peter Norvig’s home page. Other favourite pages of mine include Aaron Sloman’s, Ross Anderson’s and Jon Crowcroft’s. In each case, what I like is the high signal-to-noise ratio.
How things change…
From Quentin’s blog.
There’s a piece in Business Insider based on an interesting fact first noted by MG Siegler. It’s this:
Apple’s iPhone business is bigger than Microsoft
Note, not Microsoft’s phone business. Not Windows. Not Office. But Microsoft’s entire business. Gosh.
As the article puts it:
The iPhone did not exist five years ago. And now it’s bigger than a company that, 15 years ago, was dragged into court and threatened with forcible break-up because it had amassed an unassailable and unthinkably profitable monopoly.
Wow! It seems only yesterday when Microsoft was the Evil Empire.


